Public Safety - Police/Sheriff
Crime has been increasing - FBI Part 1 crimes in Rancho Cucamonga as compared to other agencies. Rancho Cucamonga use to rate #2 safest city, but now dropped to #6th
Criminal Homicide - Rape - Robbery - Aggravated Assault
Staffing Levels are below FBI recommendations
Officer Safety has decreased
Rancho Cucamonga's drop in public safety rankings is considered tied to a widening gap between high-density population growth and law enforcement staffing levels.
Historically celebrated as the #2 safest city in California, the city has experienced an uptick in FBI Part 1 violent crimes—specifically Criminal Homicide, Rape, Robbery, and Aggravated Assault—slipping to lower slots on regional safety indices.
The Staffing and Crime Metric Breakdown is considered Failing to Meet Federal Recommendations: The FBI commonly recommends a baseline staffing ratio of roughly 1.5 to 2.5 sworn officers per 1,000 residents depending on regional demands. Rancho population is estimated to be 178,000 in 2025. Using an Average between 1.5 to 2.5 or 2.0 x 178 = 356 officers. Will the City explain that this level has been met, or has not been met?
Formula (County Average Cost Salaries and Benefits of a Deputy Sheriff x 356 = $X Sheriff Contract Cost for Salaries and Benefits of Rancho Sheriff staff = should equal $X or greater.
Due to rapid population expansion from multi-family complexes, the Rancho Cucamonga Police Department (contracted through the San Bernardino County Sheriff's Department) has seen its per-capita officer ratio fall significantly below these federal metrics. FBI Part 1 Crime Inflation: As raw numbers for violent crimes rise along heavily congested transportation corridors, the city's per-capita crime score has faced downward pressure. When compared to adjacent agencies that have aggressively funded extra proactive patrols, Rancho Cucamonga’s contract-based staffing limits mean fewer units are available for preventative visibility. Degraded officer Safety: Lower active staffing levels mean fewer patrol units are on duty per beat during a single shift. When responding to high-risk Part 1 calls, backup arrival times are extended, severely lowering officer safety margins and forcing single units to handle volatile situations alone for longer durations.
Local Impact of contract policing law enforcement is managed via a contract with the County of San Bernardino, and the City Council controls the exact number of personnel it pays for: The Population vs. Patrol Lag: by adding high-density housing/commercial projects (ie Hamilton) adds thousands of new emergency calls for service annually. If the city does not explicitly vote to fund and add more deputies to the Sheriff’s contract, the existing police force is stretched across a denser, more congested geography. Rising Call for Service strains Officers that are spending an increasing percentage of their shifts running from call to call rather than conducting targeted proactive policing, which allows property crimes and localized physical assaults to expand.
The other causes the City may not be properly funding to police industry standards – is the same reason San Bernardino City went bankrupt. Fire Pension and Salaries had gotten out of control. Simply, government budget shortfalls are increasingly driven by a structural mismatch between escalating public safety personnel costs and unencumbered deferred liabilities. When public safety salaries and benefits outpace revenue growth, municipalities frequently face structural deficits. To balance immediate operational budgets, local governments often delay long-term obligations—such as infrastructure maintenance or pension funding—creating a ballooning wave of deferred costs that eventually compounds fiscal distress. MunicipalBond.com states the cause was “The city offered more generous retirement benefits than most California cities, including higher employer pension contributions and a city charter that set police officer and firefighter salaries by formulas”. Did the City of San Bernardino use salary comparisons of Rancho Cucamonga High Fire Salaries to establish Salary Comps?
It should be noted that certain data on crime in Rancho Cucamonga is no longer available. Mapping data is gone yet is available for surrounding cities. Details from the FBI crime data center - on crimes within the city are no longer tracked or not broken out like Chino Hills (Sheriff Contract City). Excuses are given like “Pandemic” or “Change in Reporting” or “Data was lost” or “We are transferring to a new system”, yet other agencies are reporting.
This is why in 1979 I was asked by the County Administrative Office, Law and Justice Agency and Probation Executive Officer (Harry Mays) to transfer to Sheriff Bureau of Administration, to provide a “Pencil Pusher” (College Degree in Business Administration) and not have “gun carrying deputies pushing pencils, but out on the street – addressing crimes. I acted as the bridge between great law enforcement leadership AND county budget operations. It was an honor to help. But it was brought to my attention law enforcement personnel (not high tech computer programmer geeks) are now writing the new Dispatch Code (replacing the outdated Tiburon/PRC dispatch system) Presently, this is only hearsay but needs validation of being false. If County Data Processing is part of the development team – everything should be OK!
SCHOOLS HAVE BEEN DAMAGED BY LACK OF COORDINATED SCHOOL SITE DEVELOPMENT
Schools are over crowded
Vehicle and Pedestrian traffic flows are over capacity and dangerous to students
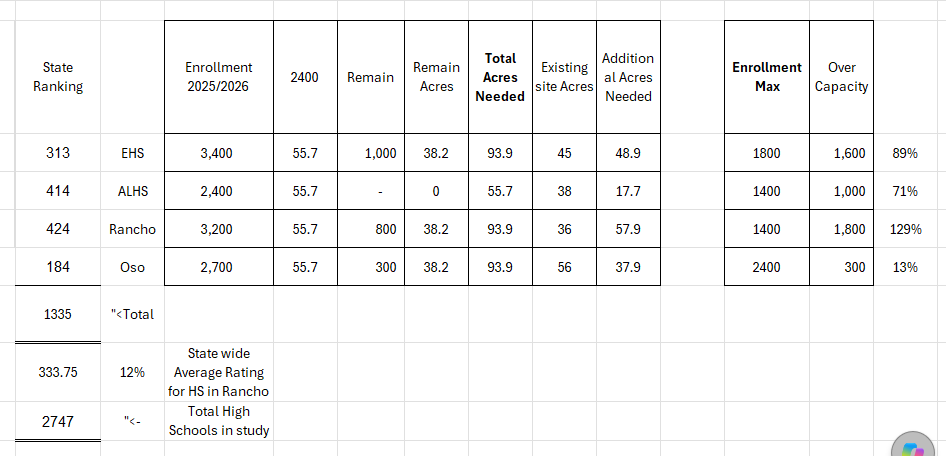
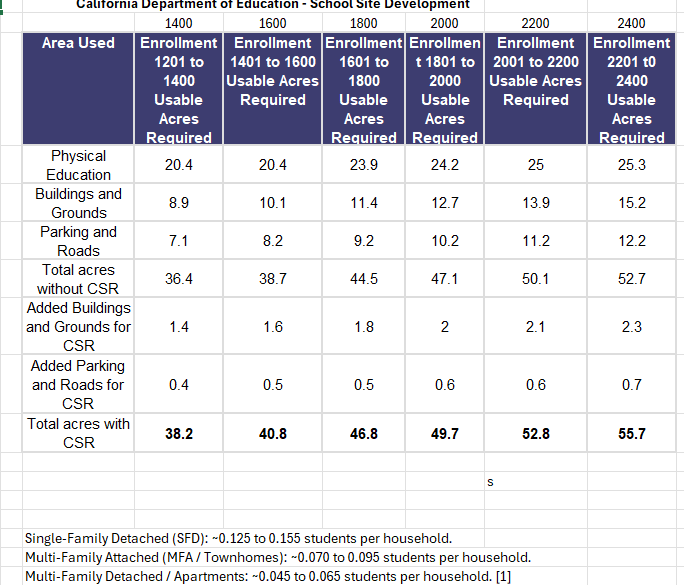
Grade performance is impacted when enrollment exceeds site capacity standards as recommended by the Department of Education
There is a negative impact on Educational Services and learning environment to students
A cursory review of high schools infer that over crowded schools rate lower.
There is an appearance the City has not help school districts in planning school facilities.
US NEWS & WORLD REPORT - HIGH SCHOOL RATINGS
Los Oso HS rated 184 in the State, and enrollment is only 13% over Dept of Education Capacity.
Ranch HS rated the lowest of the high schools in the city - at 424, and was at 129% over DOE capacity.
Conclusion = The higher over site capacity a school is - the lower the performance
The good news is Rancho Cucamonga High schools rated in the top 12% of the 2,747 schools rated.
Rancho 424 Rank
————-→
OSO 184 Rank
RCHS 129% over capacity
←————-
OSO 13% over capacity
Neighborhood Development Disruption
New High Density Developments are exceeding original General/Specific Plan density limits. Negative impacts from the new developments have been unaddressed (A kick the can down the road mentality). In the end, the local community - tax payers/residents, gets stuck alone to address and pay for the negative impacts caused by others.
Pedestrians Safety - When new housing projects increase vehicle volume without updating street designs, a dangerous environment is created for anyone walking. This has been clearly demonstrated by the increase of pedestrians vs vehicle accidents - including tragic accidents.
Traffic congestion - The trip to the local school, park or the market/service venue now face longer delays . Public pushback is increasing due to traffic bottlenecks. With adjoining high growth cities traversing into Rancho Cucamonga - traffic delays increase. What will happen to Etiwanda High School and Etiwanda Intermediate School when 6,000 new units come on line in Fontana (x2 cars = 12,000 cars in the A.M. and P.M.) and block the streets (Victoria, East Ave., Etiwanda Ave., and Baseline) which are already backed up. Not to mention the projects being proposed 6,000 units (x2 cars = 12,000 cars AGAIN) being proposed in Etiwanda Heights, and traveling to their school of choice - EHS & EIS
Infrastructure - Underground Water, Sewer, Utilities are over burdened and design standards (and size) are not adequately being addressed - with impacts being pushed to the breaking point.
This assessment points directly to a high-stakes loophole in modern planning models leading to "deferred mitigation" of sub-surface infrastructure.
By pushing major underground water, sewer, and utility upgrades to the final phases of a multi-stage development buildout, cities allow immediate, high-density demand to strain systems originally built to single-family design standard.
SUPPORTING BUSINESS COMMUNITY
Areas of Concern: Economic Stability & Public Safety Infrastructure
Strategic Partnership
Partner with local Chamber of Commerce, Real estate Agents and business community to drive economic stability, streamline regulations, and provide actionable market insights that support both new developments and existing operations. Further review will be necessary.
Law Enforcement & Business Protection
Enhance Police Visibility: Deploy targeted patrols and proactive policing in commercial corridors to prevent property crime and protect business assets and operations in coordination with Business Security.
Proactive Security Partnerships: Collaborate directly with business owners and the San Bernardino County Sheriff's Department to share real-time security data and address localized safety concerns. Crime trends - crime analysis.
Protect Public Integrity: Ensure response protocols are optimized to safeguard retail staff, customers, and operations, maintaining a secure environment that encourages customer traffic.
Vacancy Rate Reduction
Deploy Market Absorption Insights: Use vacancy data (tracking duration, square footage, and location trends) to aggressively market vacant commercial spaces to high-value tenants.
Streamline Permitting: Review and eliminate dysfunctional state, county, and city regulations to cut the time it takes for a new business to open its doors.
Promote Zoning Compatibility: Balance zoning rules to attract diverse outside revenue streams while keeping new commercial projects compatible with surrounding neighborhoods.
Traffic Flow & Infrastructure Optimization
Evaluate Access and Restrictions: Audit current commercial logistics, delivery zones, and commuter access points to eliminate bottlenecks.
Mitigate Development Impacts: Analyze impending growth trends to ensure infrastructure improvements keep pace with new high-density projects and retail developments.
Improve Commercial Transit: Optimize signal timing and corridor layouts around major business hubs to ensure smooth traffic flow for both consumers and logistics providers.
DEVELOP ACTION PLANS
1. Data-Driven Decision Making & Market Research
Develop leading economic indicators to track and strengthen business decisions, focusing on:
Vacancy metrics (square footage, duration, and geographic location).
Growth and stability factors (environmental impacts, access, restrictions, and infrastructure limits).
Prepare comprehensive market research data to assist existing businesses and guide new development projects.
Conduct Market Absorption Studies to accurately project demand by analyzing trends within the local municipality and surrounding communities.
2. Balanced Zoning & Strategic Growth
Optimize zoning regulations to balance community integration with revenue generation.
Increase outside revenue streams to boost the local economy.
Develop regional labor resources to ensure businesses have access to a skilled workforce.
Ensure community compatibility so that new commercial developments align with neighborhood standards.
3. Regulatory Reform & Implementation
Review regulations at all levels (State, County, and City) to identify and eliminate dysfunctional or obsolete red tape.
Execute proven strategic plans by implementing frameworks that have a documented history of success.
Provide robust marketing support to elevate local businesses and promote economic opportunities.